Working with Predicted Aligned Error Matrices in Jalview
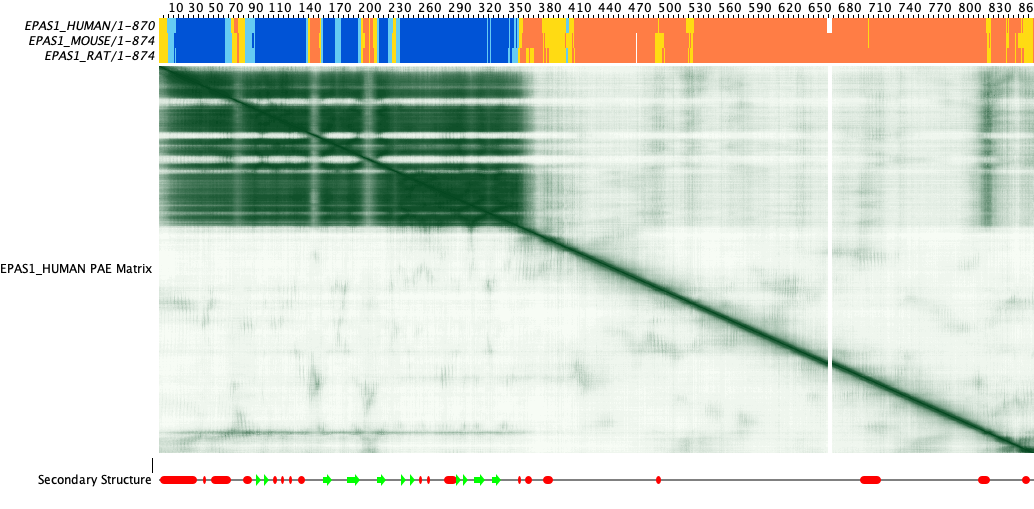
Predicted Aligned Error (PAE) matrices are produced by deep-learning based 3D-structure prediction pipelines such as AlphaFold. They reflect how reliably two parts of a model have been positioned in space. Each column in a PAE matrix corresponds to a residue in the model, and rows correspond to other residues in the model for which the PAE is calculated.
For AlphaFold, the value of the PAE is each cell is the likely RMS (Root Mean Squared) error (in Ångstroms) between predicted and observed position for the residue corresponding to each row when the real structure and model are superimposed using the column's residue.
Jalview visualises PAE matrices as an alignment annotation track, shaded from dark green (for low PAE), to white (for high PAE), similar to the encoding used on the EBI-AlphaFold website (see O04090 3D model at EBI-AlphaFoldDB).
Importing PAE Matrices
Jalview retrieves PAE matrices when importing predicted 3D structures from the EBI-AlphaFold database via Jalview's structure chooser GUI. If you have produced your own models and accompanying PAE matrices using a pipeline such as ColabFold, then you can load them both together via the Load PDB File dropdown menu in the 3D structure chooser, providing it is in a supported PAE format.
The Command Line Interface also provides the option to import a PAE matrix alongside a 3D structure file, enabling the automated production of alignment figures annotated with PAE matrices and PLDDT scores.
Showing PAE Matrix Annotations
When viewing 3D structures from the EBI-AlphaFold database or local 3D structures with an associated PAE file, the PAE is imported as Reference Annotation, and is not always automatically added to the alignment view.
To show the PAE, right click the sequence and locate the 'Add Reference Annotation' entry in the Sequence ID submenu, or select all sequences and locate the option in the Selection submenu. You can do this in any alignment window (or view) where a sequence with associated PAE data appears.
Adjusting the height of PAE matrix annotations
PAE annotations behave in the same way as Jalview's line graph and histogram tracks. Click+dragging up and down with the left (select) mouse button held down will increase or decrease the height of the annotation. You can also hold down SHIFT whilst doing this to adjust the height of all PAE rows at once.
PAE matrix annotation rows behave like any other sequence associated annotation, with the following additional features:
PAE matrices are useful for identifying regions of 3D structure predictions that are likely to be positioned in space in the same or similar way as shown in the predicted structure data. Regions of low PAE often correlate with high alphafold reliability (PLDDT) scores, but also complement them since they highlight well-folded regions such as domains, and how well those regions have been predicted to be positioned relative to each other, which is important when evaluating whether domain-domain interactions or other contacts can be trusted.
To make it easy to identify regions of low PAE, Jalview can cluster the PAE matrix, allowing columns of the matrix to be grouped according to their similarity, using an Average Distance (UPGMA) tree algorithm and the sum of differences between each column's PAE values.
distij = ∥ pi-pj ∥
Creating a PAE matrix tree
Right click on a PAE annotation's label
to open the annotation popup menu, and select Cluster
Matrix. Once the calculation has finished, a tree viewer will open,
and columns of the matrix are then partitioned into groups such that
the third left-most node from the root is placed in its own group.
Colours are randomly assigned to each group. By default column group colours will
also be overlaid on the matrix annotation row - this can be turned off
via the PAE annotation row menu (by unticking Show groups on matrix).
The PAE matrix tree viewer behaves like other tree views, except:
PAE matrices and Jalview Projects
Any PAE matrices imported to Jalview are saved along side any trees and clustering defined on them in Jalview Projects.
Support for visualision and analysis of predicted alignment error matrices was added in Jalview 2.11.3.