Principal Component Analysis
A principal component analysis can be performed via the calculations dialog which is accessed by selecting Calculate→Calculate Tree or PCA....
This calculation creates a spatial representation of the similarities within a selected group, or all of the sequences in an alignment. After the calculation finishes, a 3D viewer displays the set of sequences as points in 'similarity space', and similar sequences tend to lie near each other in the space.
Caveats
The calculation can be computationally
expensive, and may fail for very large sets of sequences - usually
because the JVM has run out of memory. However, the PCA
implementation in Jalview 2.10.2 employs more memory efficient
matrix storage structures, allowing larger PCAs to be performed.
About PCA
Principal components analysis is a technique for examining the structure of complex data sets. The components are a set of dimensions formed from the measured values in the data set, and the principal component is the one with the greatest magnitude, or length. The sets of measurements that differ the most should lie at either end of this principal axis, and the other axes correspond to less extreme patterns of variation in the data set.
Calculating PCAs for aligned sequences
Jalview can
perform PCA analysis on both proteins and nucleotide sequence
alignments. In both cases, components are generated by an
eigenvector decomposition of the matrix formed from pairwise similarity
scores between each pair of sequences. The similarity score model is
selected on the calculations dialog, and
may use one of the available score matrices, such as
BLOSUM62,
PAM250, or the simple single
nucleotide substitution matrix, or by sequence percentage identity,
or sequence feature similarity.
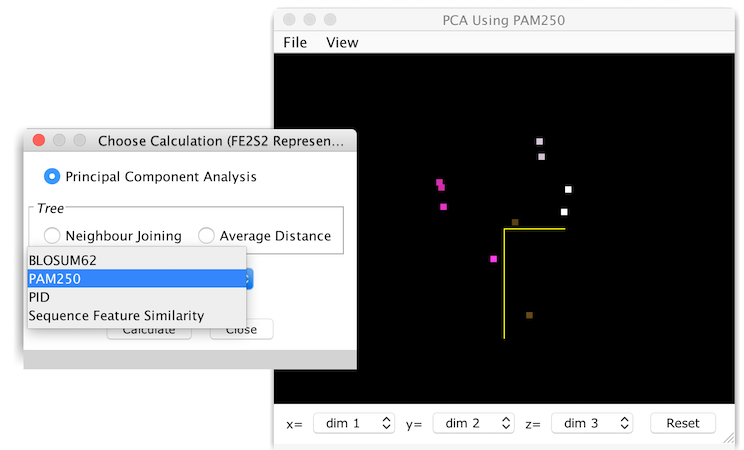
The PCA Viewer
This is an interactive display of the sequences positioned within the similarity space, as points in a rotateable 3D scatterplot. The colour of each sequence point is the same as the sequence group colours, white if no colour has been defined for the sequence, and grey if the sequence is part of the currently selected group. The viewer also employs depth cueing, so points appear darker the farther away they are, and become brighter as they are rotated towards the front of the view.
The 3d view can be rotated by dragging the mouse with the left mouse button pressed, or with the arrow keys when SHIFT is pressed. The view can also be zoomed in and out with the up and down arrow keys (and the roll bar of the mouse if present). Labels will be shown for each sequence if the entry in the View menu is checked, and the plot background colour changed from the View→Background Colour.. dialog box. The File menu allows the view to be saved (File→Save submenu) as an EPS or PNG image or printed, and the original alignment data and matrix resulting from its PCA analysis to be retrieved. The coordinates for the whole PCA space, or just the current view may also be exported as CSV files for visualization in another program or further analysis.
Options for coordinates export are:
A tool tip gives the sequence ID corresponding to a point in the space, and clicking a point toggles the selection of the corresponding sequence in the associated alignment window views. By default, points are only associated with the alignment view from which the PCA was calculated, but this may be changed via the View→Associate Nodes sub-menu.
Initially, the display shows the first three components of the similarity space, but any eigenvector can be used by changing the selected dimension for the x, y, or z axis through each one's menu located below the 3d display. The Reset button will reset axis and rotation settings to their defaults.
The output of points and transformed point coordinates was added to the Jalview desktop in v2.7. The Reset button and Change Parameters menu were added in Jalview 2.8. Support for PAM250 based PCA was added in Jalview 2.8.1.In Jalview 2.11, support for saving and restoring PCAs in Project files was added, and the Change parameters menu removed.
Reproducing PCA calculations performed with older Jalview releases Jalview 2.10.2 included a revised PCA implementation which treated Gaps and non-standard residues in the same way as a matrix produced with the method described in the paper by G. Casari, C. Sander and A. Valencia. Structural Biology volume 2, no. 2, February 1995 (pubmed) and implemented at the SeqSpace server at the EBI. To reproduce calculations performed with earlier Jalview releases it is necessary to execute the following Groovy script:
    jalview.analysis.scoremodels.ScoreMatrix.scoreGapAsAny=true
    jalview.analysis.scoremodels.ScoreModels.instance.BLOSUM62.@matrix[4][1]=3
This script enables the legacy PCA mode where gaps were treated as
'X', and to modify the BLOSUM62 matrix so it is asymmetric for
mutations between C to R (this was a typo in the original Jalview
BLOSUM62 matrix which was fixed in 2.10.2).